Over the 2018 NFL offseason, we will break down some of the key statistics surrounding the San Francisco 49ers’ 2017 season. Today, we will analyze the Jimmy Garoppolo Effect on the 2017 Niners’ points-per-drive and scoring percentage.
Last week, we discussed San Francisco 49ers quarterback Jimmy Garoppolo’s effect on the team’s 2017 yards-per-drive statistic. To summarize, with fellow quarterbacks Brian Hoyer and C.J. Beathard under center, the 49ers averaged 26.6 yards-per-drive, which was the seventh lowest average in the NFL. However, with Garoppolo at quarterback, the 49ers averaged over 42 yards-per-drive — tops in the league in 2017, and more than the historic 2016 Atlanta Falcons. You can check out last week’s article here.
This week, we transition from the important yards-per-drive statistic to the even more telling points-per-drive statistic. Yardage tells a lot of the story, but an offense’s primary objective is to score points, and with a limited number of drives each game, good offenses take advantage of a high percentage of these scoring opportunities.
As we discussed last week, the correlation between points scored and yards-per-drive is strong. In 2017, the New England Patriots were second in points scored, and led the league with over 39 yards-per-drive; of the top 10 teams in yards-per-drive, six were also in the top 10 in offensive points scored.
However, the correlation between points scored and points-per-drive is even stronger. In 2017, the top four teams in offensive points scored — the Los Angeles Rams, the Patriots, the Philadelphia Eagles and the New Orleans Saints — were also the top four teams in points-per-drive.
In 2017, the 49ers finished the season near the middle of the pack with 1.8 points-per-drive, but they struggled pre-Garoppolo, managing just 1.4 points-per-drive — even less than their 1.6 points-per-drive in 2016. However, with Garoppolo under center, the 49ers averaged 2.9 points-per-drive, topping even the league-leading Patriots:
While this alone is impressive, when we dig a little deeper, Garoppolo and the 49ers actually had room for improvement. Due to drives that stalled in the red zone — some of which were mostly outside the control of the QB — Garoppolo’s 49ers were forced to settle for field goals over touchdowns at a rate that is unlikely to be repeated next season.
In 2017, only five teams other than the 49ers ended the season with less offensive touchdowns than field goals, and each team missed the mark by no more than five touchdowns. Yet in just five games, Garoppolo’s 49ers had a larger field-goal-to-touchdown discrepancy than every other team over the entire 2017 season.
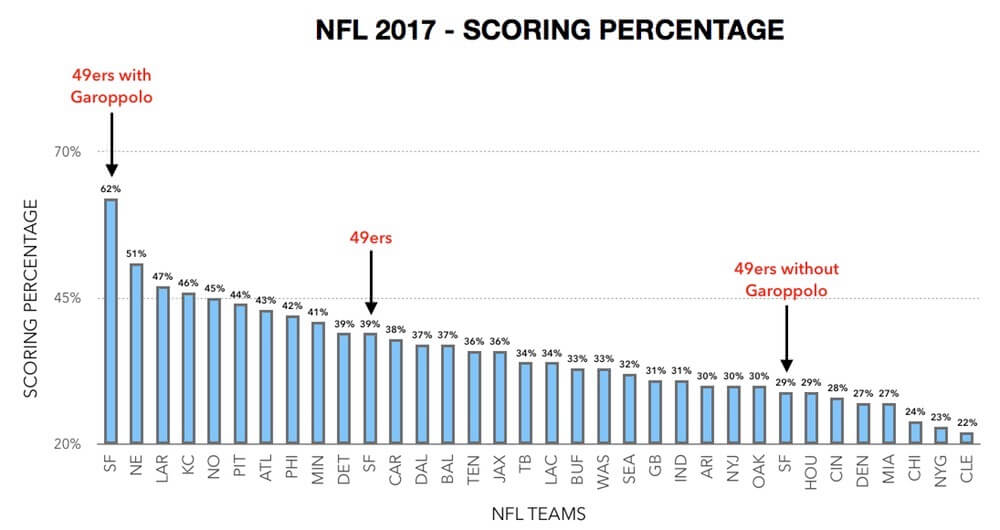
With such a low field-goal-to-touchdown ratio, how did the 49ers score so many points during their five-game winning streak? Simply, under Garoppolo, the 49ers had the highest scoring percentage in the NFL.
For perspective, NFL teams scored on 35 percent of their drives in 2017. With Garoppolo under center, the 49ers kicked field goals on an outlandish 36 percent of their drives, converting as many field goal attempts in five weeks as six other NFL teams did in 16 games. Plus, Garoppolo’s 49ers scored touchdowns on an additional 26 percent of their drives — good for fourth highest in the league.
In 2017, 62 percent of Garoppolo’s drives ended in a score:
While a 62 percent scoring percentage will be quite difficult to repeat, it’s likely that the 49ers’ field-goal-to-touchdown ratio will significantly regress to the mean in 2018. If Garoppolo can continue to score at a high rate, and the team can convert a portion of their field-goal attempts into touchdowns, the 49ers will have one of the NFL’s top offenses in 2018.
Stay tuned here at Locked On 49ers, as we dig into the reasons behind the team’s red-zone problems, and what the San Francisco 49ers — and Jimmy Garoppolo – can do to improve in 2018.
All statistics were compiled using data from multiple sources, including Pro Football Reference, ESPN and Football Outsiders.

