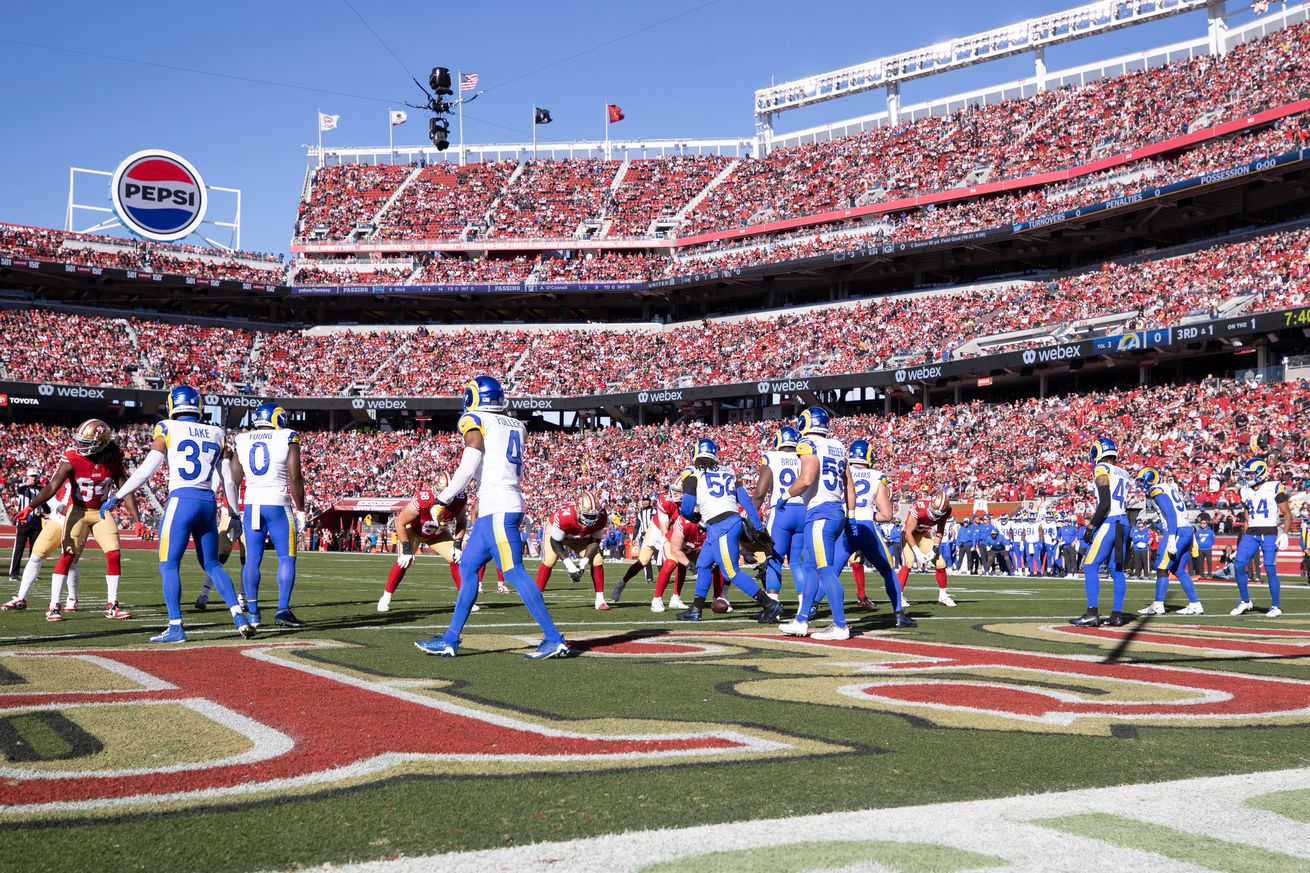

We’ll start by breaking these two teams down using variance
Throughout the week, we plan on breaking down every aspect of the San Francisco 49ers matchup between the Green Bay Packers. Let’s start with the phase of the game that we only talk about when something goes wrong: Special teams.
These teams have plenty of strengths, but the kicking game is not one. The Niners rank 26th in special teams DVOA, while the Pack are 31st. Each team has taken a step back from a season ago, when they were 15th and 16th, respectively.
Variance
The 49ers fumbled the eighth-fewest times in the NFL, while Green Bay was 14th. Both teams did an excellent job of taking care of the football in that sense. They were equally as fortunate to recover those fumbles.
The Packers recovered 70 percent of their fumbles, which marked the third-highest rate in the league. Meanwhile, the Niners were ninth, recovering 57 percent. There’s no way to determine how the ball will bounce once it hits the ground. Both teams benefitted from fumble luck this season.
Third downs
The best offenses in the NFL don’t get to third down. The 49ers were ruthlessly efficient this year, as they faced the fewest third downs in the NFL by a comfortable margin. San Francisco was on the field for 192 third downs compared to 242 for the Packers.
Jordan Love and Brock Purdy led their offenses to convert third downs at a top-5 rate. That doesn’t change when you change how you’re judging a team by third downs. For example, nobody is expected to convert 3rd & 17, but 3rd & 5 is more than manageable. Kyle Shanahan’s crew finished second in the NFL in third down conversions over expectation, exceeding expectations by 8 percent. The Packers weren’t far behind; they were fifth at 5.7 percent over expectation.
Another way to gauge a unit is by using EPA, which tells us whether they generate big plays. Nothing changes here, either. San Francisco ranks second in EPA per play on third downs, while the Packers are fourth.
We are talking about two offenses operating at an elite level.
Red zone
How often you move the ball per drive and into the red zone is a better predictive measure of your offense than how many points you score.
Unsurprisingly, the Packers and 49ers are in the top five in red zone trips, too. Green Bay had one more trip to the red zone this season than the 49ers. If we’re using season-long metrics, the Packers were middle of the road, as they only converted a touchdown on 54 percent of their trips.
Red zone efficiency will be one of the most crucial deciding factors in the game. If Love and the Packers offense is settling for three points, the 49ers will find themselves in the NFC Championship game.
No team converted touchdowns at a higher rate than the Niners. This season, they converted 67 percent of red zone trips into touchdowns. However, at this juncture, we should only be referencing second-half stats.
Fortunately, the 49ers’ number went up a touch to 68.6 percent. Green Bay’s does as well to 56 percent, but that still leaves them in the middle of the pack.
You’re not beating Purdy and this offense with field goals. Not at home. Not unless peak Joe Burrow is rolling into Levi’s Stadium.
Defensive variance
Let’s switch gears and talk about the same three categories, just on defense. Both units were above average during the second half, forcing ten and nine fumbles. There’s a stark contrast in fumble luck. Green Bay recovered seven of the ten fumbles they faced.
Conversely, the Niners only recovered three of the nine fumbles they forced since Week 10. Hopefully, they have better luck in the playoffs when the ball bounces around on the ground.
Third down defense
The more we dig into defensive stats, the more you’ll see why the Niners are favored to win by double-digits. Green Bay faced the fifth-most third downs after Week 10. San Francisco was 17th.
Teams got to third down against the Packers and converted, as they allowed the fifth-highest conversation rate over expectation. The Niners were 11th, which is slightly below average.
As for EPA allowed on third downs, Green Bay allowed the sixth-highest against compared to San Francisco, ranking 12th. The difference in the number is significant. The Packers EPA allowed on third downs was 0.22, compared to the 49ers’ -0.01.
Red zone defense
No team allowed more trips inside of their red zone than Gren Bay since Week 10. Nine teams allowed at least 30 red zone trips. Green Bay had one more than Seattle at 36. Here’s the top five:
Packers – 36
Seahawks – 35
Cowboys -32
Commanders – 31
Eagles – 31
Think about how porous those defenses were in the second half. You don’t have to use your imagination too much, as we just watched the Cowboys’ and Eagles’ defense allow their opponent to go up and down the field. Well, using a two-month sample size, the Packers were worse.
Steve Wilks’ defense surrendered 26 red zone trips, which was the tenth-lowest rate in the NFL. They allowed a touchdown inside the 20 50 percent of the time, which was the 9th-best rate. Green Bay was at 58 percent, good for 13th.
Both teams will move the ball, but the numbers suggest one team won’t have an issue scoring, while the road team may need good fortune to stay in the game.
